
Table of Contents >> Show >> Hide
- What Counts as “the U.S. Stock Market”?
- Long-Term Gains: The Market’s Favorite Magic Trick
- Losses: The Admission Price of Stock Market Gains
- By the Numbers: Why One Bad Day Does Not Define a Year
- The Biggest Gains Often Arrive Near the Scariest Losses
- Market Capitalization: Why Big Companies Move the Index
- Volatility: The Market’s Mood Ring
- Household Stock Ownership: Who Feels the Gains and Losses?
- The Power and Danger of Individual Stocks
- Sectors: Where Gains and Losses Hide
- Interest Rates: The Invisible Hand on the Scale
- Dividends: The Quiet Part of Total Return
- Inflation-Adjusted Returns: What Did Investors Really Earn?
- Corrections Are Normal, But Planning Is Not Optional
- Practical Example: Two Investors, Same Market, Different Results
- Experiences and Lessons From Watching U.S. Stock Market Gains and Losses
- Conclusion: The Numbers Tell a Better Story Than the Noise
- SEO Tags
The U.S. stock market is a scoreboard, a weather report, a popularity contest, and occasionally a roller coaster with no seatbelt sign. One day investors are cheering record highs; the next day everyone is suddenly an expert on inflation, interest rates, oil prices, Federal Reserve policy, and why their portfolio looks like it stepped on a rake.
But underneath the noise, the market tells a story through numbers. Returns, losses, drawdowns, valuations, volatility, market capitalization, sector weights, household ownership, and compounding all help explain what is really happening. The trick is not to stare at one red or green trading day and assume it explains the entire economy. That is like judging a movie after watching one popcorn kernel fall on the floor.
This guide breaks down U.S. stock market gains and losses by the numbers, using long-term data, real market behavior, and practical examples. Whether you are trying to understand the S&P 500, market corrections, bear markets, index investing, volatility, or why a few giant companies can move the whole market, the numbers make the picture much clearer.
What Counts as “the U.S. Stock Market”?
When people say “the market is up” or “the market is down,” they usually mean one of three major U.S. indexes: the S&P 500, the Dow Jones Industrial Average, or the Nasdaq Composite. Each one measures a different slice of the market.
The S&P 500
The S&P 500 is widely treated as the main benchmark for large U.S. companies. It includes 500 leading companies and represents a major share of the available U.S. equity market. Because it is market-cap weighted, larger companies have more influence than smaller ones. That means a move in a mega-cap technology stock can matter more than a move in dozens of smaller companies.
The Dow Jones Industrial Average
The Dow tracks 30 large blue-chip companies. It is famous, historic, and quoted constantly, but it is narrower than the S&P 500. Because it is price-weighted, higher-priced stocks can influence the index more heavily, even if they are not the biggest companies by total value.
The Nasdaq Composite
The Nasdaq Composite includes thousands of stocks listed on the Nasdaq exchange and has a strong tilt toward technology and growth companies. When investors want to know how high-growth names, artificial intelligence stocks, software firms, and semiconductor leaders are behaving, they often look at Nasdaq performance.
Long-Term Gains: The Market’s Favorite Magic Trick
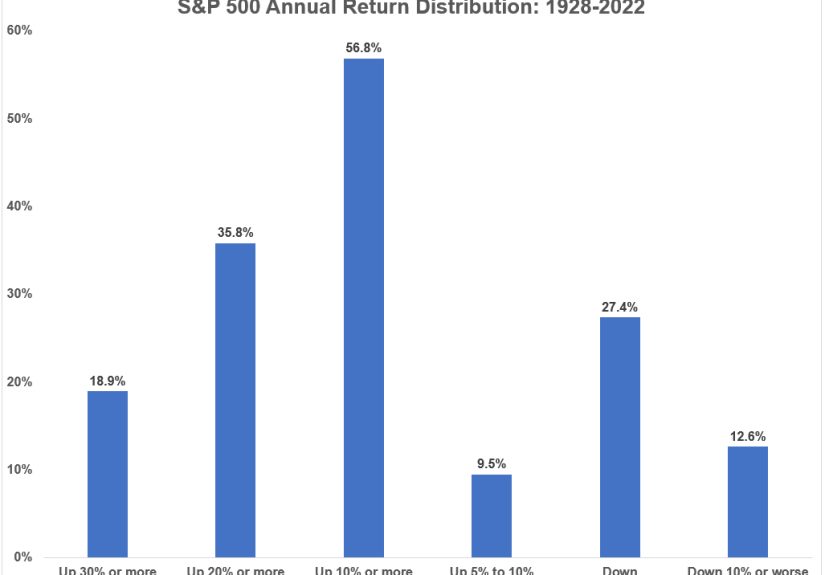
Over long periods, U.S. stocks have historically rewarded patient investors. The S&P 500 has delivered strong long-term total returns, especially when dividends are included. Since 1928, annual results have varied wildly, but the broad trend has been upward. That does not mean every year is profitable. It means compounding has done most of its work over decades, not over lunch breaks.
For example, historical S&P 500 data shows enormous differences from year to year. There have been booming years with gains above 30%, painful years with losses near or above 30%, and many ordinary years somewhere in between. The market’s long-term wealth creation is not a smooth escalator. It is more like climbing a mountain while occasionally being chased by raccoons.
The important number is not just the average annual return. It is the combination of time, reinvestment, and staying invested through ugly periods. A portfolio that survives downturns has the chance to participate in recoveries. A portfolio that panics at every dip may miss the strongest rebounds.
Losses: The Admission Price of Stock Market Gains
Stock market gains attract investors, but losses are the price of admission. Corrections, bear markets, and crashes are not glitches in the system. They are part of the system.
Common Market Decline Terms
A pullback is usually a modest decline from a recent high. A correction is commonly understood as a drop of about 10% or more. A bear market is typically a decline of 20% or more. A crash is a sharper and faster collapse, often driven by panic, forced selling, financial stress, or sudden economic shocks.
These labels matter because they help investors separate normal volatility from deeper trouble. A 3% dip can feel dramatic on a phone screen, but in market history it is basically the financial version of sneezing. A 20% decline, on the other hand, can change behavior, headlines, and retirement account moods across the country.
By the Numbers: Why One Bad Day Does Not Define a Year
One of the strangest truths about the U.S. stock market is that a year can include scary declines and still end with a positive return. The S&P 500 often experiences meaningful intra-year drops even during years that finish higher.
This matters because investors tend to experience losses emotionally and gains mathematically. A portfolio decline of 12% in March feels personal. A full-year gain of 9% in December feels normal. The market knows this and, frankly, has terrible manners.
The lesson is that temporary losses are not automatically permanent losses. A decline becomes permanent when an investor sells, when a company fails, or when a portfolio is built so poorly that it cannot recover. Broad indexes have historically recovered from many major downturns, but individual stocks do not always get a comeback tour.
The Biggest Gains Often Arrive Near the Scariest Losses
Market rebounds can be fast. Some of the strongest trading days have occurred during periods of extreme volatility, including bear markets and crisis recoveries. That creates a difficult problem: investors who sell after a sharp decline may avoid some additional downside, but they also risk missing the early rebound.
This is why timing the market is so hard. You have to be right twice: once when getting out and once when getting back in. Many investors discover that the second decision is harder. After prices fall, the news still looks bad. After prices rise, it feels too late. The result is a classic investing tragedy: selling low, waiting for “certainty,” and buying back when the market has already put on a tuxedo and left for the party.
Market Capitalization: Why Big Companies Move the Index
Market capitalization is the total value of a company’s shares. A company worth $3 trillion has far more influence in a market-cap-weighted index than a company worth $30 billion. This is why a handful of giant firms can drive a large portion of index gains or losses.
In recent years, mega-cap technology and artificial intelligence-related companies have carried a major share of U.S. market performance. That has helped indexes rise when those leaders perform well. It has also increased concentration risk. If the biggest stocks stumble, the broad index can feel the impact even when many smaller stocks are doing fine.
This is one reason investors compare the market-cap-weighted S&P 500 with the equal-weight S&P 500. The regular S&P 500 gives more weight to giants. The equal-weight version gives each company the same influence. When the market-cap-weighted index is far ahead, leadership may be narrow. When equal-weight performance improves, participation may be broader.
Volatility: The Market’s Mood Ring
Volatility measures how much prices move. The Cboe Volatility Index, commonly known as the VIX, is often used as a gauge of expected near-term volatility in the S&P 500. When fear rises, the VIX often rises too. When markets are calm, it usually settles lower.
Volatility is not automatically bad. Without volatility, there would be fewer opportunities for long-term returns. The problem is that volatility feels different depending on whether prices are moving up or down. Investors rarely complain about “upside volatility.” Nobody says, “Oh no, my portfolio rose too quickly; please send help.”
Downside volatility is the real test. It challenges patience, planning, and risk tolerance. A portfolio that looks brilliant in a bull market may feel unbearable in a bear market if it was built without considering losses.
Household Stock Ownership: Who Feels the Gains and Losses?
Stock market performance affects millions of Americans, but not equally. Many households own stocks indirectly through retirement accounts, mutual funds, exchange-traded funds, pensions, or college savings plans. Others own individual stocks directly. Higher-income households tend to hold a larger share of stock wealth, which means market gains often increase wealth more for families that already have significant assets.
This creates a gap between “the market is doing great” and “people feel financially great.” A record high in the S&P 500 does not automatically mean every household is thriving. Someone with a large retirement portfolio may feel wealthier. Someone with no stock exposure, high rent, and rising grocery bills may understandably wonder what celebration they were not invited to.
The Power and Danger of Individual Stocks
One of the most important findings in stock market research is that a relatively small percentage of companies have historically created a large share of total market wealth. Many individual stocks underperform safe short-term Treasury bills over their lifetimes. Some go nowhere. Some disappear. A small group becomes extraordinary winners.
This explains why diversified investing is so powerful. An investor who owns the broad market does not need to guess every future winner. The winners are included automatically. By contrast, an investor picking a few individual stocks must be both selective and lucky enough to own the rare companies that drive long-term wealth creation.
That does not mean individual stock investing is foolish. It means the numbers are humbling. Picking stocks can be exciting, but excitement is not the same as probability. A diversified core can help investors avoid turning their financial future into a talent show judged by earnings calls.
Sectors: Where Gains and Losses Hide
The U.S. stock market is divided into sectors such as technology, health care, financials, consumer discretionary, industrials, energy, utilities, real estate, materials, communication services, and consumer staples. Each sector responds differently to economic conditions.
Technology may lead during periods of innovation and strong earnings growth. Energy may benefit when oil prices rise. Utilities may attract investors seeking stability. Financials often react to interest rates, loan demand, and credit conditions. Consumer discretionary companies can shine when households are spending freely, but they can struggle when budgets tighten.
Sector rotation is one reason the market can look healthy on the surface while parts of it are struggling underneath. The headline index might rise because a few large sectors are strong, even while smaller sectors are flat or falling.
Interest Rates: The Invisible Hand on the Scale
Interest rates are one of the biggest forces behind stock market gains and losses. When rates are low, future corporate earnings may look more valuable, borrowing can be cheaper, and investors may be more willing to pay higher prices for growth. When rates rise, bonds and cash can become more attractive, borrowing costs increase, and expensive stock valuations can come under pressure.
This is why markets pay close attention to inflation data and Federal Reserve policy. A small change in expected interest rates can move stocks, bonds, currencies, and commodities at the same time. Wall Street may look like it is reacting to one number, but usually it is reacting to what that number means for the next dozen decisions.
Dividends: The Quiet Part of Total Return
Price gains get most of the attention, but dividends have historically played an important role in total stock market returns. A stock index can be measured as a price return index or a total return index. The price return version tracks price changes only. The total return version includes reinvested dividends.
This distinction matters. Over long periods, reinvested dividends can significantly increase wealth through compounding. Dividends may look boring compared with fast-growing tech stocks, but boring can be underrated. Boring pays bills, reinvests quietly, and does not demand applause.
Inflation-Adjusted Returns: What Did Investors Really Earn?
Nominal returns show the percentage gain before inflation. Real returns adjust for inflation. If a portfolio gains 8% while inflation is 3%, the real gain is roughly 5%. If a portfolio gains 4% while inflation is 6%, purchasing power has actually declined.
This is why inflation can make market analysis tricky. A rising stock market is good, but the real question is whether wealth is growing faster than the cost of living. Investors do not spend percentages; they spend dollars with purchasing power.
Corrections Are Normal, But Planning Is Not Optional
The numbers show that declines are normal. The personal experience of declines, however, is never casual. A 15% drop on a chart looks clean. A 15% drop in a real account feels like someone deleted several months of good decisions.
A practical plan should consider asset allocation, emergency savings, time horizon, and risk tolerance. Money needed soon should generally not be exposed to the same risk as money intended for decades in the future. Long-term investors can usually tolerate more volatility than someone who needs cash next year.
Diversification does not eliminate losses, but it can reduce the damage from being overexposed to one company, sector, or asset class. Costs also matter. High fees create a drag that compounds over time. Taxes can matter too, especially for frequent traders.
Practical Example: Two Investors, Same Market, Different Results
Imagine two investors during a volatile year. Investor A owns a diversified index fund, keeps adding money monthly, and checks the account occasionally. Investor B watches every tick, buys after big rallies, sells after scary headlines, and treats financial news like a personal emergency broadcast.
Both investors experience the same market. But their results may be very different. Investor A benefits from discipline and consistency. Investor B may accidentally convert temporary volatility into permanent underperformance through emotional trading.
The market’s numbers matter, but behavior matters too. Returns are not only earned by choosing assets. They are also earned by surviving the emotions that come with owning them.
Experiences and Lessons From Watching U.S. Stock Market Gains and Losses
One of the clearest lessons from observing U.S. stock market cycles is that confidence is usually loudest near the top and fear is usually loudest near the bottom. During strong bull markets, investors often start believing that gains are easy, obvious, and permanent. The market becomes a friendly machine that prints green numbers. Then a correction arrives, and suddenly everyone remembers that risk was in the room the whole time, quietly eating chips in the corner.
A useful experience for any investor is learning to separate market movement from personal judgment. When a portfolio falls, it does not automatically mean the investor made a terrible decision. Sometimes broad markets decline because interest rates rise, earnings expectations change, geopolitical risks increase, or investors simply decide prices ran too far. A good investment can still lose value temporarily. A bad investment can still rise temporarily. Price movement and quality are related, but they are not identical twins.
Another important experience is realizing that headlines are designed to capture attention, not necessarily to improve decision-making. “Stocks plunge” sounds urgent. “Market experiences historically normal volatility while long-term fundamentals remain mixed” is more accurate in many cases, but nobody clicks that unless they are trapped in an airport with 4% battery. Investors who react to every headline may end up making too many decisions. In investing, unnecessary activity can be expensive.
It also becomes clear over time that cash feels safest right after markets fall, while stocks often look safest after they have already risen. This emotional timing is dangerous. The best long-term opportunities often appear when the news feels uncomfortable. That does not mean investors should blindly buy every dip. It means fear should be studied, not automatically obeyed.
Watching market gains and losses also teaches the value of having rules before emotions arrive. A written plan can answer questions such as: How much should be in stocks? How much should be in bonds or cash? When should rebalancing happen? What amount of loss is expected in a bad year? Which money is long term, and which money should stay safe? Without those answers, every downturn becomes a debate with your nervous system.
Perhaps the most practical lesson is that the market rewards patience unevenly. Some years deliver huge gains. Some years deliver losses. Some years do very little except test whether investors can stay awake. Long-term compounding often depends on sitting through all three. The boring middle years matter more than they seem because they keep the investor in position for the powerful years that nobody can schedule in advance.
Finally, the numbers show that humility is not optional. No investor knows the future with certainty. Analysts can estimate earnings. Economists can forecast rates. Strategists can model valuations. But markets are living systems shaped by businesses, policy, technology, human emotion, and surprises. The smartest approach is not pretending to predict every move. It is building a portfolio and a mindset that can handle being wrong sometimes and still move forward.
Conclusion: The Numbers Tell a Better Story Than the Noise
U.S. stock market gains and losses are not random fireworks. They reflect earnings, interest rates, inflation, investor expectations, innovation, risk appetite, liquidity, and human behavior. The numbers show that long-term gains have historically been powerful, but they have never arrived without setbacks.
The S&P 500, Dow, and Nasdaq can all rise or fall for different reasons. Mega-cap companies can drive index performance. Volatility can scare investors out of good plans. Dividends and compounding can quietly build wealth. Inflation can reduce real returns. Diversification can help manage risk, while concentration can magnify both gains and losses.
The best takeaway is simple: do not let one trading day become your entire investment philosophy. The U.S. stock market has rewarded patience, discipline, and diversification over long periods, but it has also punished overconfidence, panic, and short-term guessing. By understanding the market by the numbers, investors can see past the noise and make better long-term decisions.